
Weekend Attendance
Attendance Measures...
Do you know what weekend attendance measures?
The number of lives we are able to touch through our worship gatherings!
It’s been eight weeks since we added the third service on August 1st and I wanted to give you an update on the results.
For starters, the average total attendance (adults + kids) this August (535) is up 52% over August of last year (351). The attendance in August was actually higher than the month of April (507) which had Easter this year! That has undoubtedly never happened before!
Over the past eight weeks (not counting Project Serve weekend), there was a noticeable shift that occurred after four weeks in the new format that significantly increases the number of lives we are able to touch each week!
I am going to throw a lot of numbers at you and even bring on some algebraic equations SO, if you are interested, read on . . . and if not, just try to attend at 8:00 or 11:00 instead of 9:30. LOL!
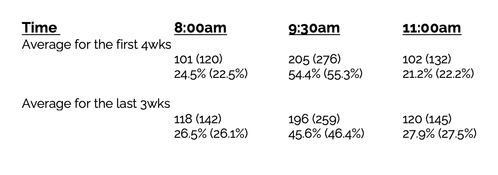
The total numbers and percentages below reflect the overall attendance of
“Adult only (Adults plus kids)”.
The number of lives we are able to touch through our worship gatherings!
It’s been eight weeks since we added the third service on August 1st and I wanted to give you an update on the results.
For starters, the average total attendance (adults + kids) this August (535) is up 52% over August of last year (351). The attendance in August was actually higher than the month of April (507) which had Easter this year! That has undoubtedly never happened before!
Over the past eight weeks (not counting Project Serve weekend), there was a noticeable shift that occurred after four weeks in the new format that significantly increases the number of lives we are able to touch each week!
I am going to throw a lot of numbers at you and even bring on some algebraic equations SO, if you are interested, read on . . . and if not, just try to attend at 8:00 or 11:00 instead of 9:30. LOL!
The total numbers and percentages below reflect the overall attendance of
“Adult only (Adults plus kids)”.
What Do These Numbers Mean?
- The effective adult capacity for a single service is about 70% of the 299 chairs filled which is about 210 people. You can see that in the first four weeks, the average adult attendance was 69% so we were at our peak for the 9:30 service even though there were still, on the average, 95 available chairs. With the percentage of chairs filled being that high, we were effectively “full” and when that happens we always expect attendance to drop.
- With one gathering being “full,” then our capacity is determined by how well we can distribute the attendance among the three services. I could show you using algebraic equations (YES, it is useful in “real” life!) but instead, I will just show you examples...
If the capacity of the largest service is 210 adults, then when that one service is 50% of the total, then our adult attendance is limited to 420. However, if we could distribute attendance a little more evenly between the three gatherings (say 40% at the largest service), then . . . (OK, here comes the algebra!)
If we let x = the overall adult attendance, 210 people were at the largest gathering which was 40% of the overall weekend adult attendance, the equation would look like this . . .
.4x = 210
x = 210/.4
x = 525
Our potential weekend adult attendance climbs by 105 people from 420 to 525!
If attendance was split evenly (33%) then the equation would look like this:
.33x = 210
x = 636 adults
NOW . . . let’s factor in the kids!
The ratio of adults to children is approximately 3.5 to 1. I will spare you the equations and just add the numbers in.
Adult attendance of 420 + 120 kids = 540
Adult attendance of 525 + 150 kids = 675
Adult attendance of 635 + 182 kids = 817
So whether our adult attendance is 540, 675, or 817 depends entirely on our ability to more evenly distribute among the three services.
Already the percentage of people attending at 9:30 has dropped from 55% to 46% and that drop improves our potential 81 adults and 23 children!
So What Does This Mean?
- Algebra is useful in real life . . . even for a preacher!
- The more people can move from 9:30 to 8:00 or 11:00, the more lives we can touch each week!
Recent
Archive
2026
April
2025
February
June
2024
2023
February
October
November
December
2022
March
June
No Comments